The fishbone diagram is a widely-used tool for problem-solving and root-cause analysis. It visually represents various factors contributing to an issue, aiding in the identification of underlying causes. In the following passage, we will delve into the fishbone diagram’s components and explore its value in addressing complex challenges across industries.
What Is a Fishbone Diagram?
Each cause category is then further broken down into specific causes or factors that may contribute to the problem. The fishbone diagram facilitates organizing and prioritizing potential causes, making it easier to identify the root cause of a problem. Specific industries, including oil and gas, petrochemical, and power plants use this diagram as a useful tool for problem-solving and quality improvement.
When To Use Fishbone Diagram?
Here are some specific situations where a fishbone diagram can be useful in root cause analysis:
1. Equipment Failure
Companies can use fishbone diagrams to analyze the potential causes of equipment failure in power plants, oil refineries, and other energy facilities. This analysis allows them to identify the root causes of equipment failure, and take steps to prevent similar issues from occurring in the future.
2. Safety Incidents
Identifying the root causes of safety incidents in the energy industry is possible through the use of fishbone diagrams. This tool enables companies to analyze the potential causes of safety incidents and take steps to improve safety procedures, preventing similar incidents from occurring in the future.
3. Environmental Incidents
Analyzing the potential causes of environmental incidents, such as oil spills or pipeline leaks, can also be done by fishbone diagram. This approach allows them to identify the root causes of these incidents, and take necessary measures.
4. Process Improvement
Fishbone diagrams offer a method to analyze processes in the energy industry and identify factors that contribute to inefficiencies or delays. Through this analysis, companies can optimize their processes and improve efficiency.

5. Quality Control
Fishbone diagrams can be a powerful tool for quality control processes in the energy industry by assisting in the identification of the root causes of defects or errors in a product or process.
Overall, a fishbone diagram is a versatile tool that can be used in a variety of situations, including root cause analysis, especially for energy industries like petroleum, power plant, and petrochemical companies. It can directly help teams to identify and prioritize potential causes of a problem, make it easier to determine the root cause, and develop effective solutions.
What Are The Structures of Fishbone Diagram?
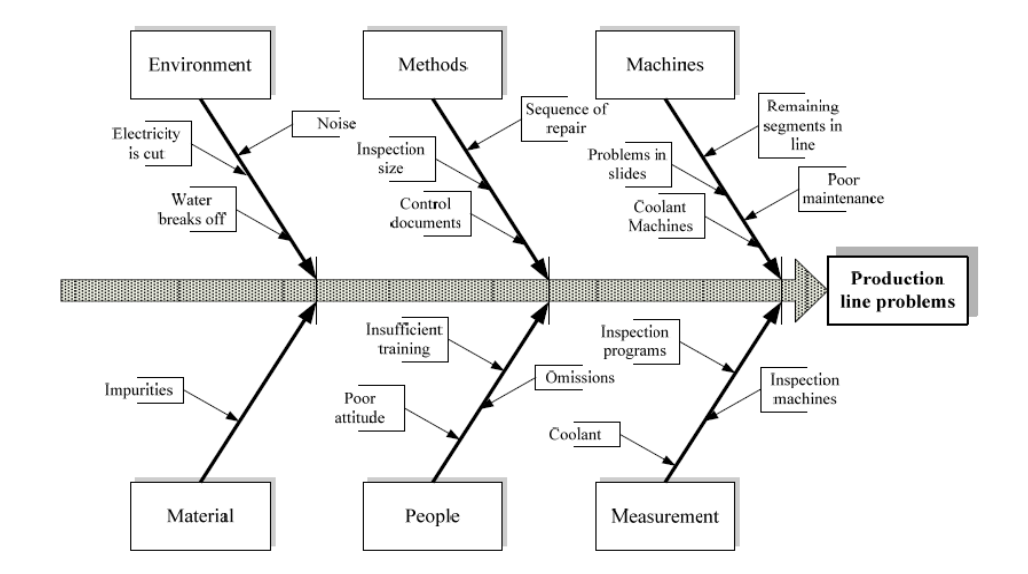
The diagram resembles a fish skeleton, with the problem being the “head” and the potential causes branching off like “bones”. Based on what to write for every part, here is the structure of the fishbone diagram.
1. Problem statement or effect
The diagram typically presents the main issue or problem being analyzed as a horizontal line on the right-hand side.
2. Major categories
The major categories of potential causes are represented by the main branches stemming from the problem statement. These categories can encompass people, processes, equipment, materials, environment, or management.
3. Sub-categories
Each major category has sub-branches extending from it to specify and elaborate on the specific factors or causes that may potentially contribute to the problem.
4. Causes
The diagram’s final structure looks like a fish skeleton, with the potential causes branching off like “bones.” Each bone signifies a specific cause that may contribute to the problem.
How To Create a Fishbone Diagram?
To create a fishbone diagram, follow these common steps:
- Identify and clearly define the problem or issue to be analyzed.
- Draw a horizontal line and write the problem statement on the right-hand side.
- Identify the major categories of potential causes, such as people, processes, equipment, materials, environment, or management, and draw angled lines to represent them branching off from the problem statement.
- https://www.youtube.com/watch?v=mLvizyDFLQ4
- Draw sub-branches extending from each major category and list specific factors or causes that could contribute to the problem.
- Use arrows to indicate the direction of the cause-and-effect relationships between the factors or causes.
- Review and refine the diagram to ensure all potential causes have been identified and properly categorized.
- Use the completed diagram to guide further analysis and develop solutions to address the root causes of the problem.
While a fishbone diagram can be a useful tool for identifying potential causes of a problem, it is important to note that it is just one part of a larger approach to problem-solving known as Root Cause Analysis (RCA). RCA involves a systematic process of identifying underlying causes of problems or incidents and taking steps to address them, rather than just treating symptoms.
Rather than just focusing on learning how to create fishbone diagrams, you can learn the whole Root Cause Analysis training course with PetroSync. Our course outline covers all the key aspects of RCA, including accident causation theories, evidence and data gathering, and modern accident analysis techniques.
We also cover important topics such as data mapping, causal factors investigation, and an overview of solution implementation. By understanding the entire RCA approach, you can gain a deeper understanding of how to effectively identify and address the root causes of problems in the energy industry.
At the end of the training, you will have a deep understanding of RCA, the tools, and the techniques used to identify and address the root cause of problems. You will be equipped with the knowledge and skills needed to drive improvements in your organization and deliver measurable results. Sign up for Root Cause Analysis training today and discover the best-adopted incident investigation with PetroSync!
Header credit image: academicjournals.org

SEO specialist by day, fact-checker by night. An avid reader and content writer dedicated to delivering accurate and engaging articles through research and credible sources.

Business Development Manager at PetroSync with 12+ years of experience in professional training and business development across the energy and industrial sectors.